By Nathan Yuan, Policy Intern and James Dysart, Associate Policy Director
Introduction
The official tally of the number of students experiencing homelessness across the United States is about 1.5 million.1 However, homelessness among school-aged children in the U.S. remains vastly underrecognized.2 Federal law through the McKinney–Vento Homeless Assistance Act (McKinney–Vento) guarantees vital support for students experiencing homelessness, but students must first be identified in order to be served. This policy brief explores an alternative method to estimate the number of students experiencing homelessness using available data from 31 states and New York City.
For this method we use data from the Centers for Disease Control and Prevention’s (CDC) 2023 Youth Risk Behavior Survey (YRBS), a biennial anonymous survey of high school students, administered in the spring of 2023. We see the YRBS as partially overcoming barriers for self-identification related to social stigmas about homelessness. We apply the YRBS estimated rate of homelessness among high school students to all grade levels, recognizing that this approach may still underestimate homelessness among younger students.
When using YRBS estimates our analysis suggests that there may have been 320,500 more students experiencing homelessness than those who were identified in the 31 states where data was available and New York City. These findings could confirm a gap in a complicated system of identification that can negatively impact services for these students. Many students experiencing homelessness already face high rates of chronic absenteeism and low graduation rates, while also being at increased risk of experiencing homelessness as adults—underscoring the need for increased investment to improve the identification to connect them with the support to which they are legally entitled. Our goal is to encourage further discourse, research, and analysis on how to get at the most accurate estimate of students experiencing homelessness. Accurate estimates matter because they can drive awareness, resource allocation, and action.
For a complete list of methodology, data sources, and charts, see the Appendix at the end of the brief.
Defining Homelessness in Education
The McKinney–Vento Homeless Assistance Act defines a student as experiencing homelessness if they lack a fixed, regular, and adequate nighttime residence. This includes students who are sharing the housing of others due to loss of housing, economic hardship, or a similar reason; staying in motels, trailer parks, or campgrounds due to the lack of an adequate alternative; staying in shelters or transitional housing or sleeping in cars, parks, abandoned buildings, substandard housing, or similar settings.3 This is the definition used by the U.S. Department of Education (ED) and school districts across the country.
Recently, the YRBS began including a survey question (see Appendix Figure 1) about housing status. The question includes both technical definitions of homelessness as well as more colloquial phrases that students are more likely to use or identify with. For instance, the YRBS survey includes an answer worded “I do not have a usual place to sleep.” This could be a teen’s way of saying “lacking a fixed or regular nighttime residence” within the McKinney–Vento definition.
Why Identification Matters
Students experiencing homelessness face the most significant barriers to education in the U.S. In School Year 2022–2023 (SY2022–2023), nearly half (48%) of these students were chronically absent from school.4 This figure was 20 percentage points higher than the national average of all students.5 The high rate of chronic absenteeism among students without a stable place to live contributes to a graduation rate of just 69%.6 These educational barriers increase the likelihood of future adult and family homelessness and could perpetuate chronic and intergenerational homelessness.7
Students experiencing homelessness face unique barriers beyond poverty.8
They include:
- Lack of a fixed address for enrollment when temporary shelter is unavailable
- Unreliable transportation to and from school or longer commutes from temporary shelter located further away from school
- Frequent school transfers due to impermanent residence or relocating to shelter
- Social stigma and fear of homelessness among peers and adults
To address the unique barriers students experiencing homelessness face, federal law guarantees certain rights through McKinney–Vento, including transportation based on student need, a streamlined school enrollment process, and support connecting students and families to community resources. However, before they can receive support through the McKinney–Vento Act, students must first be identified as experiencing homelessness.
Nationally, 1.5 million public school students were identified as experiencing homelessness in SY2023-2024.9 Research of prior years suggests that this is likely an undercount. One study estimated that two-thirds of high school students experiencing homelessness are missing from official tallies.10 While federal law places the responsibility for identifying students on school districts, many districts face significant challenges in capturing accurate numbers. These challenges partially stem from limited federal funding. Other sources of challenges might include a lack of trust between families and schools, a lack of community acceptance, and a lack of prioritization of students experiencing homelessness.
Understanding the potential scope of underidentification is the first step towards closing the gap, not only in identifying students but, more importantly, in getting them the services they need. Two recent studies looked at the impacts of federal funding on identification. Their findings noted that the likelihood of underidentification is higher in schools without dedicated homeless education funding11 and that additional federal funding led to better academic outcomes for students experiencing homelessness, while delays in funding led to worse academic outcomes.12
Analysis and Key Findings
McKinney–Vento data is not the only data we have available on the numbers of students experiencing homelessness. Another source is the YRBS. The YRBS is an anonymous survey administered to high-school students in a sample of schools across the U.S. The survey is used to produce national and local estimates for different health risk behaviors. In 2023 the YRBS asked high-school students about their housing situations using a question designed to align with the McKinney–Vento definition of homelessness.
Since the YRBS is an anonymous, self‑reported survey, students can answer all questions—including the newer items about housing status and where they sleep—without fear of stigma or concern about completing official paperwork or unwanted agency involvement. As a result, the YRBS may paint a more complete picture of student homelessness when combined with other indicators. We used data from the 2023 YRBS survey and McKinney–Vento data from SY2022–2023. Not all jurisdictions where the YRBS was administered included questions on housing. McKinney–Vento and YRBS data are released at different times, and the McKinney–Vento data for School Year 2023-2024 was released just prior to the publication of this; however, these new numbers do not affect the core of our analysis. Both methods have potential tradeoffs but for the purpose of this analysis we present how the weighted YRBS estimate compares with the McKinney–Vento numbers. The reviewed YRBS data only captured responses from high school students. We recognize that U.S. Department of Education (ED) rates of homelessness among high school students are lower than those for middle and elementary school students (see Appendix Tables 2–3). Despite the limitations, in order to further explore the use of YRBS, we applied each jurisdiction’s YRBS-estimated high school homelessness rate across grades K–12 recognizing that this likely yields a conservative estimate across jurisdictions.
Then, by comparing those estimates with the number of students identified as experiencing homelessness in the McKinney–Vento data, we were able to calculate potential gaps in the reported counts. We found gaps where the YRBS estimated count was statistically significantly higher than the reported McKinney–Vento count; these were determined to be cases of potential underidentification. However, this also suggests that YRBS is not the only indicator for jurisdiction level success. These gap estimates are best interpreted as indicators of potential gaps to create a more complete picture of student homelessness, rather than precise totals.
Key Takeaways:
![]() 320,500 Potential Students Experiencing Homelessness Went Unidentified
320,500 Potential Students Experiencing Homelessness Went Unidentified
In half of the jurisdictions (16 of 32) there was likely an undercount of homeless students in SY2022–2023.
![]() Potential Underidentification May Be Widespread
Potential Underidentification May Be Widespread
In addition to the 16 jurisdictions with likely undercounts, we found an additional eight jurisdictions where there is a potential undercount.
![]() Closing the Gap Requires Sustained Investment and Identification
Closing the Gap Requires Sustained Investment and Identification
Conclusion
The findings from this analysis highlight a potential gap between the number of students experiencing homelessness and those officially recognized as homeless through current methods. The consistency of the pattern across jurisdictions indicates that many students might be unrecognized and therefore disconnected from support they are legally entitled. This analysis is meant to be considered in the larger context of improving reporting and identification of students experiencing homelessness. YRBS alone might not create a complete picture, therefore further discussion and investigation must be made into the reasons for this reporting gap.
Taken together, the results point to three central implications. First, a clearer understanding of the magnitude and nature of the identification gap is necessary for any effort to strengthen services for students experiencing homelessness. Second, improving identification relies on sustained attention to resourcing. Third, further research and dialogue are needed to refine approaches and tools, such as YRBS, to improve the understanding of the official counts and build a more accurate national picture of student homelessness.
Acknowledgements
We are deeply grateful to Bess A. Rose, Ed.D., for serving as an advisor throughout the research and writing of this project.
We thank colleagues at SchoolHouse Connection, including Barbara Duffield and Sara Shaw, PhD, for their thoughtful feedback and guidance.
We also thank J.J. Cutuli, PhD, for his thoughtful review and insights.
We would like to extend our gratitude to the Sanford S. Parker Research Fellowship, awarded by the Department of Economics at Columbia University, and the Phyllis Stevens Sharp Fellowship in American Politics, awarded by the Department of Political Science at Columbia University, for their support of Nathan Yuan during this project.
Appendix
Methods
This analysis used state-level data from the CDC’s 2023 Youth Risk Behavior Survey (YRBS) administered in the spring of 2023 to a representative sample of high school students. In total, 31 states and NYC included a question asking respondents about their housing status aligned with the U.S. ED definition of homelessness (See Appendix Figure 1).13
Appendix Figure 1: Question Regarding Homelessness in YRBS Survey in Spring 2023
86. During the past 30 days, where did you usually sleep?
- A. In my parent’s or guardian’s home
- B. In the home of a friend, family member, or other person because I had to leave my home or my parent or guardian cannot afford housing
- C. In a shelter or emergency housing
- D. In a motel or hotel
- E. In a car, park, campground, or other public space
- F. I do not have a usual place to sleep
- G. Somewhere else
Source: Centers for Disease Control and Prevention (CDC), “2023 YRBS Data User’s Guide, Youth Risk Behavior Survey Data,” 2024, https://www.cdc.gov/yrbs/media/pdf/2023/2023_National_YRBS_Data_Users_Guide508.pdf.
Note: Responses to the question with Answers A or G counted as “not homeless,” and Answers B, C, D, E, or F were considered “homeless.”
The CDC uses the counts and percentages of students responding to the YRBS in sampled high schools, calculates survey response weights, and applies those survey response weights to estimate the true counts and percentages in each state or jurisdiction. For more information from the CDC about their sampling and weighting procedures, please go to “YRBS Data Across Years and Sites.” 14
We used those estimates of the percentage of high school students self-reporting homelessness given by the YRBS, as well as the lower and upper bounds for the 95% confidence interval for those estimates, and multiplied the percentages by the total K–12 public school enrollment in each jurisdiction to estimate the total number of homeless students across grades K through 12. We then compared these figures with each jurisdiction’s official count of students identified as homeless under McKinney–Vento submitted to the ED, and we identified jurisdictions where the McKinney–Vento count was statistically significantly lower than the extrapolated YRBS estimate as jurisdictions where potential undercounting was taking place. We have only considered providing undercount estimates that were outside of the estimated YRBS results confidence interval. We believe this analysis is best understood as finding potential gaps and serving as a baseline for state agencies and school districts to investigate their state- and district-level plans, resource allocation, and identification practices. However, YRBS estimates compared to official counts alone likely does not present a full indication of the success or failure of each jurisdiction.
Using these methods, we identified 16 jurisdictions where likely undercounting or under-identifying occurred (highlighted in dark blue in Appendix Table 1). Eight additional states reported figures below our adjusted estimate but above the lower bound (highlighted in light blue). In these cases, we treat the difference between the adjusted estimate and the reported count as a potential undercount. We defined eight jurisdictions as not undercounting where the official count of students experiencing homelessness was similar to or higher than our adjusted estimate (highlighted in gray). However, this does not mean that no students go unidentified in these jurisdictions. See Appendix Table 1 and Appendix Figure 2 for our estimates for each jurisdiction.
In our analysis we assumed that homelessness rates for elementary and middle school students are at least equal, if not higher than those of high school students. We believe it is likely that applying the YRBS results, which are based on high school students, to all grades (K–12), will result in an underestimate of the true number of homeless students, yet this estimate may still be closer to the actual number of students experiencing homelessness.
Data from the McKinney–Vento program suggests that rates of homelessness are associated with grade level, and if they are, that homelessness is about 10% higher for middle and elementary school students than for high school students. In recent years, the rate of homelessness in high school has been less than the rate of homelessness in elementary and middle school. We conducted a one-tailed z test of two proportions. The resulting z statistics are shown in Appendix Table 2. For each year, the z statistics reflect a p value of effectively 0 (<0.000001), illustrating that the rate of homelessness in K–8 is greater than the rate of homelessness in grades 9–12.
Appendix Table 3 and Appendix Figure 2 represent the rate of homelessness broken down by grade levels (K–12). It is also important to note that for all five school years represented, the highest rate of homelessness for each grade was in first and second grade, and the lowest rate of homelessness was in high school. We believe this further supports the hypothesis that the rate of homelessness in grades K–8 is higher than the rate of homelessness in grades 9–12. Further analysis that considers the variation in homelessness rates by grade level and YRBS survey methods could more accurately apply the YRBS data to students in grades K–8.
Appendix Table 1: Comparison of Student Homelessness Identification by Jurisdiction
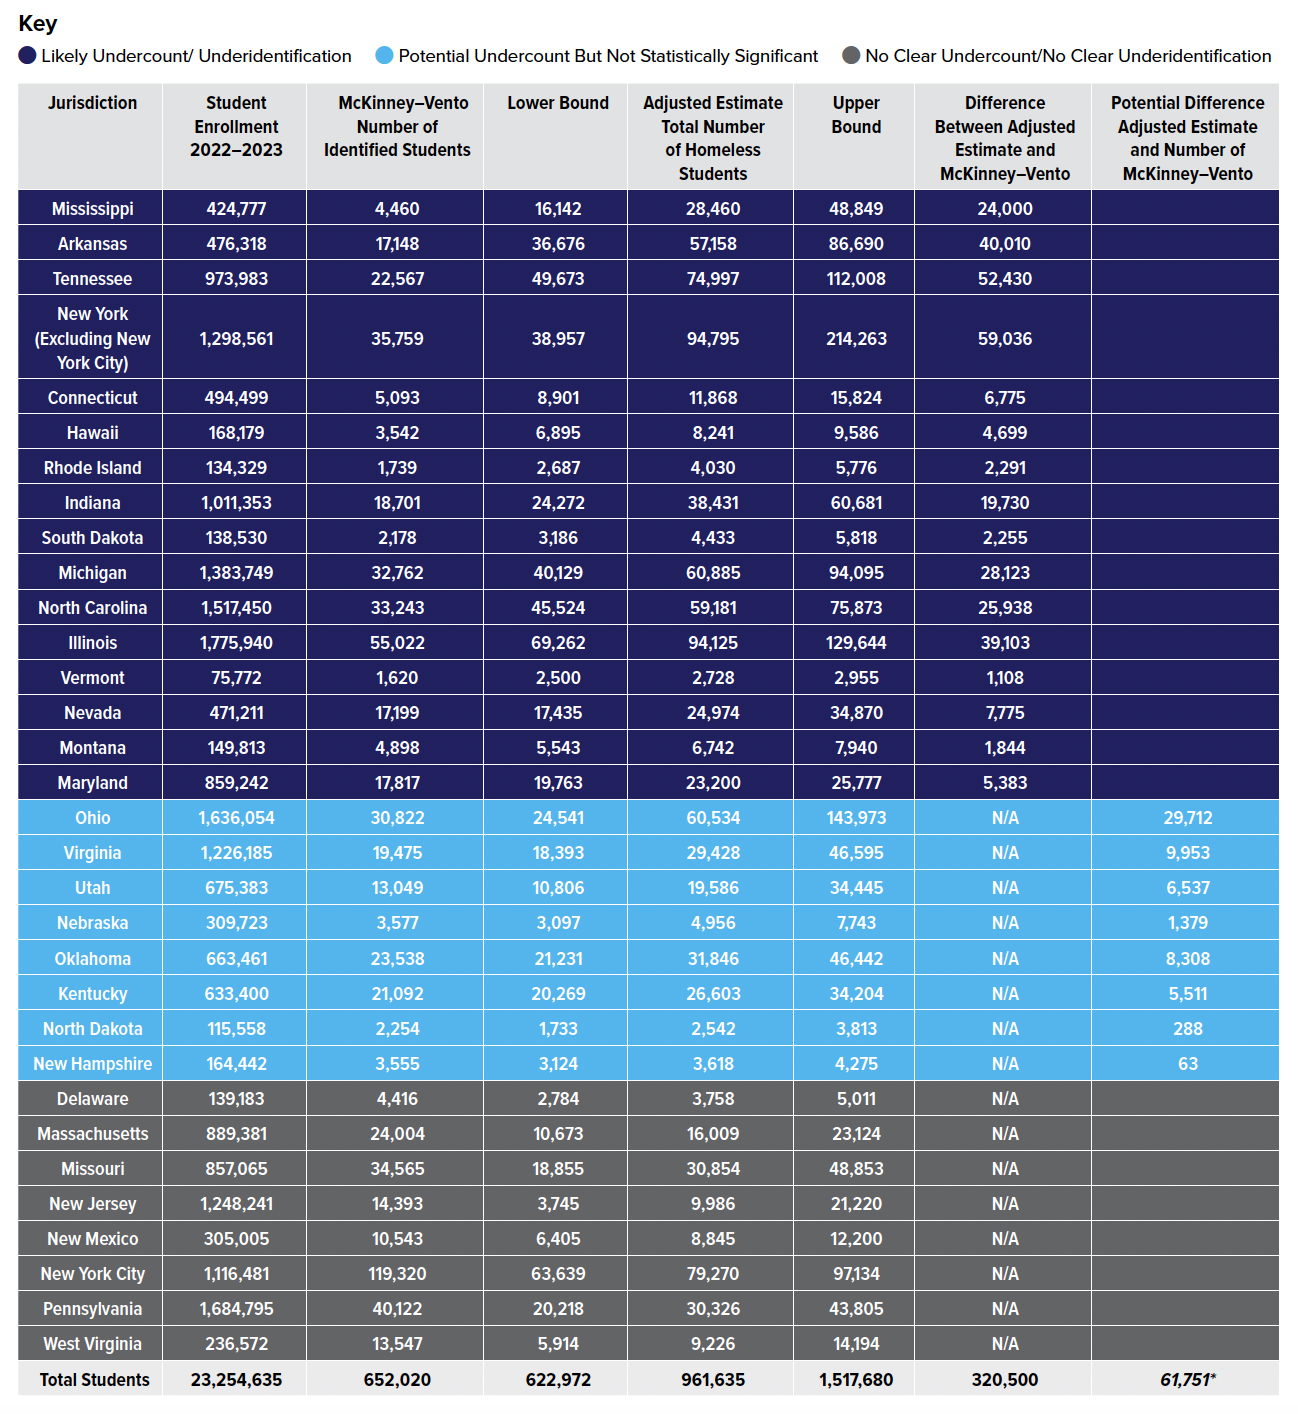
Sources: U.S. Department of Education (ED), “EDFacts file specification 118, SEA Level McKinney–Vento Counts SY 22–23,” https://eddataexpress.ed.gov/dashboard/homeless/2022-2023?sy=2955&s=1035. Accessed July 2025; Centers for Disease Control and Prevention (CDC), “Youth Risk Behavior Survey Data” (CDC, 2023), https://www.cdc.gov/yrbs/data/index.html, Accessed July 23, 2025;
New York City Department of Education. “Students in Temporary Housing Reports.” Nyced.org, 2023. https://infohub.nyced.org/reports/government-reports/students-in-temporary-housing-reports. Accessed July 23, 2025;
National Center for Education Statistics, “Table 203.40, Enrollment in Public Elementary and Secondary Schools, by Level, Grade, and State or Jurisdiction: Fall 2022,” https://nces.ed.gov/programs/digest/d23/tables/dt23_203.40.asp.
The National Center for Homeless Education. “Student Homelessness in America: School Years 2020–21 to 2022–23.” U.S. Department of Education, 2024. https://www.ed.gov/media/document/student-homelessness-america-school-years-2020-21-2022-23-108414.pdf.15
Note: NYC and New York State (excl. New York City) are considered separate jurisdictions for this analysis. NYC does not participate in the New York State YRBS and chooses to administer its own YRBS. The total enrollment of students does not include ungraded students. Estimated number of unidentified students denoted with * are not statistically significant and therefore are counted as potentially unidentified students. The 61,751 total students represent a potential additional number of unidentified students.
One potential alternative explanation may be that this trend does not necessarily show that the rate of homelessness is higher for students in middle and elementary school; rather, it could be that this trend is the result of younger students being identified and accounted for at higher rates.
Another explanation is that potentially identifiable adolescents experiencing homelessness have already dropped out of high school and are not captured by school-based data.
A potential source of underestimation in the YRBS data stems from the YRBS only asking about a student’s housing status for the last 30 days and depends on students being present for the survey, while the official count of homeless students submitted by states to U.S. ED reflects the number of students who were identified as experiencing homelessness at any point during the entire course of a school year. All else being equal, this definitional difference should lead to higher counts in the McKinney–Vento data than in the YRBS.
Appendix Table 2: National Rate of Student Homelessness in Primary (Grades K–8) Versus Secondary (Grades 9–12) School
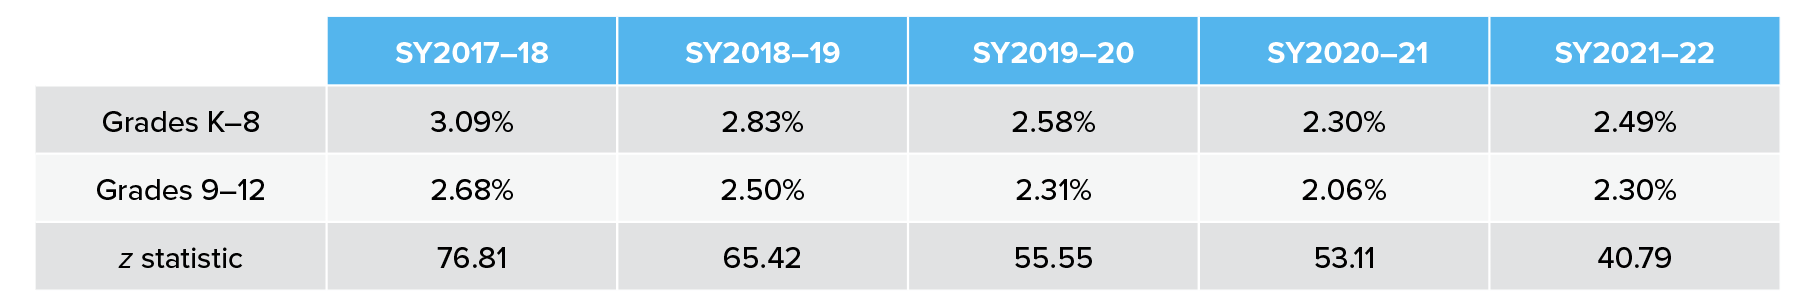
Sources: National Center for Education Statistics, Table 2023.30, “Enrollment in public elementary and secondary schools, by region, state, and jurisdiction: Selected years, fall 1990 through fall 2023.” https://nces.ed.gov/programs/digest/d23/tables/dt23_203.40.asp; U.S. Department of Education, “EDFacts file specification 118, SEA Level (2017, 2018, 2019, 2020, 2021).” Collected by National Center for Homeless Education.16,17,18
Note: Percentages based on calculations from total grouped enrollment data from National Center for Education Statistics compared to total student population.
Appendix Table 3: National Rate of Student Homelessness by Grade Level
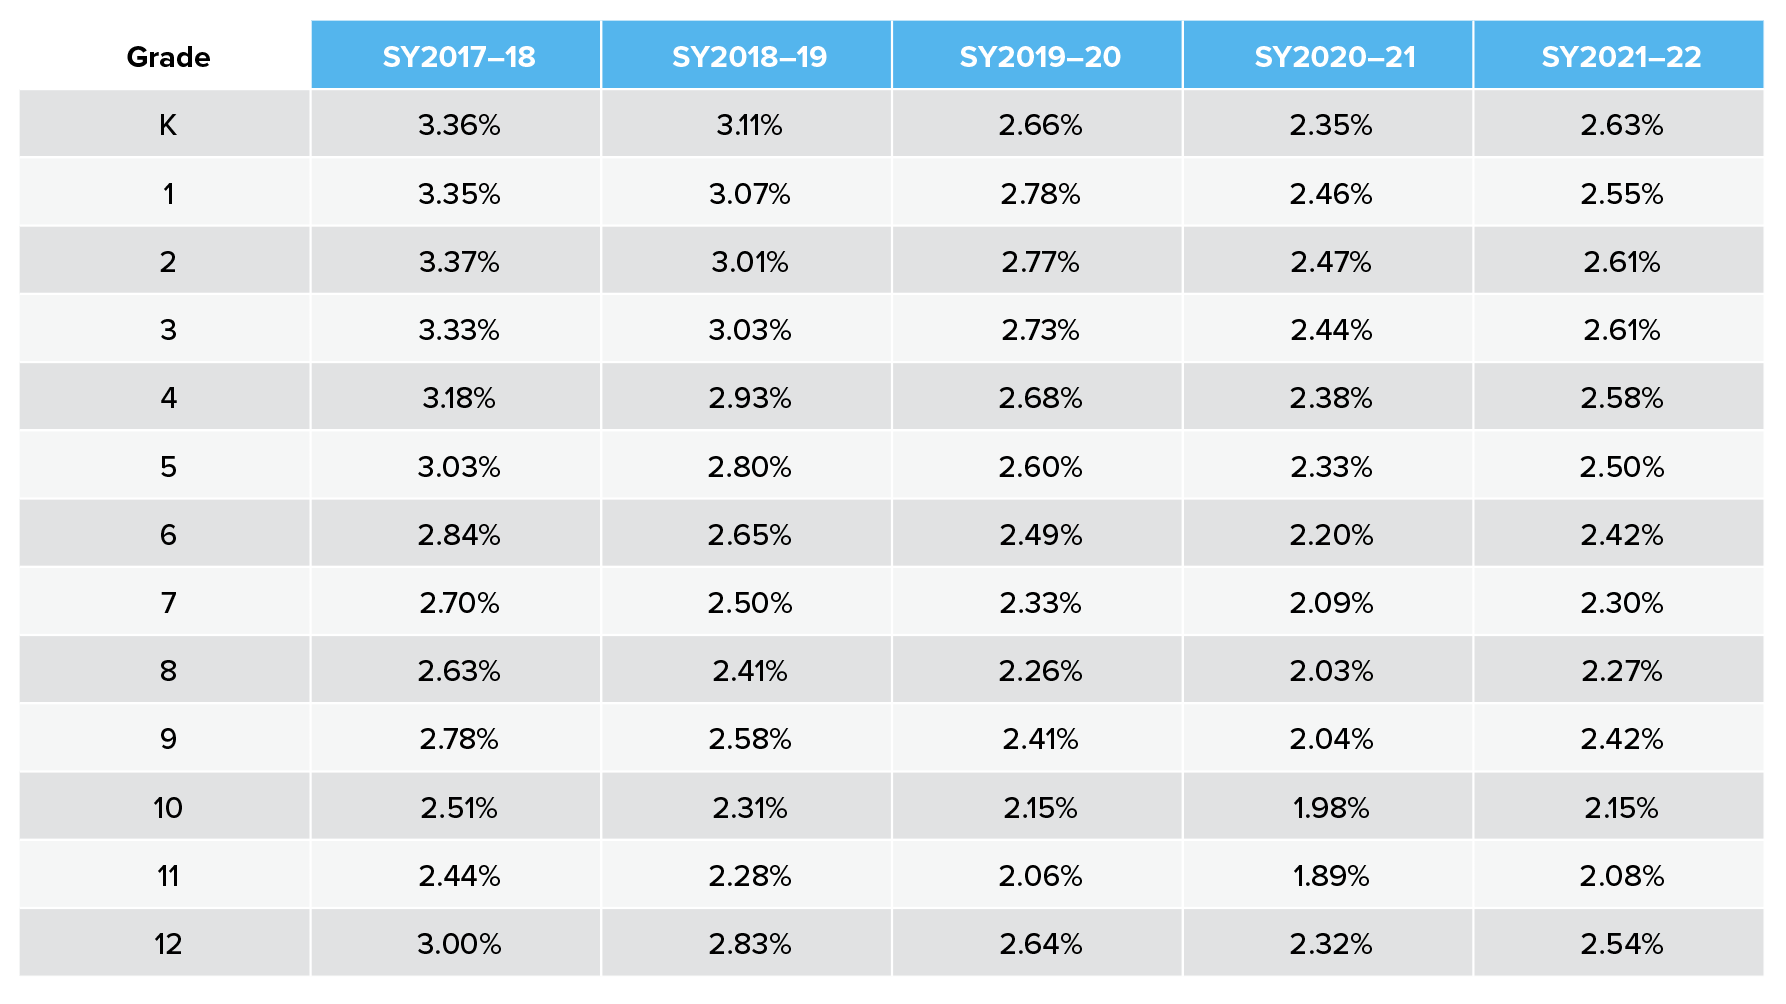
Sources: National Center for Education Statistics, Table 2023.30, “Enrollment in public elementary and secondary schools, by region, state, and jurisdiction: Selected years, fall 1990 through fall 2023.” https://nces.ed.gov/programs/digest/d23/tables/dt23_203.40.asp; U.S. Department of Education, “EDFacts file specification 118, SEA Level (2017, 2018, 2019, 2020, 2021).” Collected by National Center for Homeless Education.19,20,21
Note: Percentages based on calculations from total grouped enrollment data from National Center for Education Statistics compared to total student population.
Appendix Figure 2: National Rate of Student Homelessness by Grade Level with Linear Smoothing
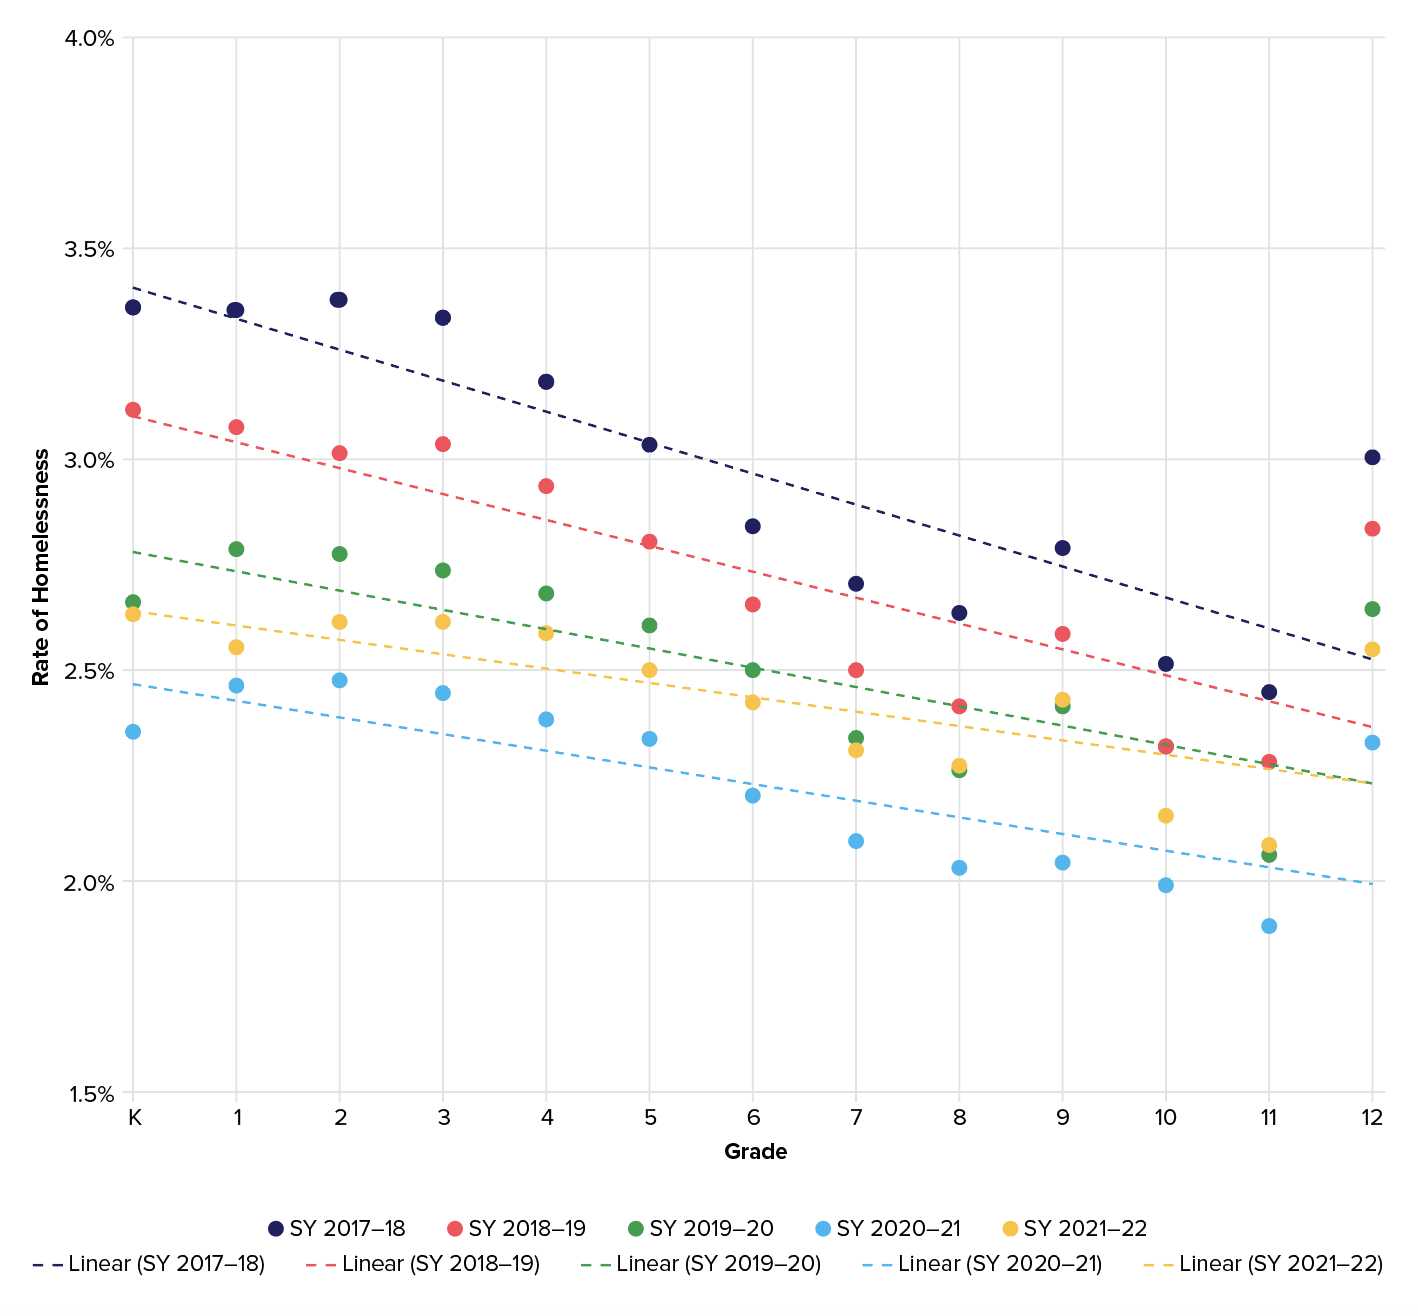
Sources: National Center for Education Statistics, Table 2023.30, “Enrollment in public elementary and secondary schools, by region, state, and jurisdiction: Selected years, fall 1990 through fall 2023.” https://nces.ed.gov/programs/digest/d23/tables/dt23_203.40.asp; U.S. Department of Education, “EDFacts file specification 118, SEA Level (2017, 2018, 2019, 2020, 2021).” Collected by National Center for Homeless Education.22,23,24
Note: Percentages based on calculations from total grouped enrollment data from National Center for Education Statistics compared to total student population.
Because the YRBS provides estimates for NYC and New York State (excl. New York City) separately, we had to take a tailored approach to our data to these jurisdictions. Data for the number of students experiencing homelessness (119,320) in NYC comes from an analysis completed by Advocates for Children using data directly from the New York City Department of Education (NYC DOE). Total enrollment data for SY2022–2023 (1,116,481) is taken from Students in Temporary Housing Reports compiled by the NYC DOE.
Massachusetts and NYC were outliers in our analysis as they reported more students experiencing homelessness than would be in the range of our YRBS estimate. One potential explanation is that both jurisdictions have versions of right-to-shelter for families with children. Therefore, we believe that our analysis is best used in jurisdictions that lack these robust needs-based emergency shelter systems.
References
1. The National Center for Homeless Education. “Education of Children and Youth Experiencing Homelessness in the United States: Data Summary for School Years 2021–22 to 2023–24.” U.S. Department of Education. 2026. pp. 9. https://nche.ed.gov/wp-content/uploads/2026/03/Education-of-CYEH-in-the-United-States-data-summary-for-school-years-2021-22-to-2023-24.pdf.
2. Hatchimonji, Danielle R., Claire A. Flatley, Dan Treglia, and J.J. Cutuli. “High School Students Experiencing Homelessness: Findings from the 2019 Youth Risk Behavior Surveillance System (YRBSS).” Nemours Children’s Health System. 2021. pp. 5. https://files.eric.ed.gov/fulltext/ED616088.pdf.
3. 42 U.S.C. §11434a(2); National Center for Homeless Education. “The McKinney–Vento Definition of Homeless.” 2018. https://nche.ed.gov/mckinney-vento-definition/.
4. The National Center for Homeless Education. “Student Homelessness in America: School Years 2020–21 to 2022–23.” U.S. Department of Education, 2024. pp. 3. https://www.ed.gov/media/document/student-homelessness-america-school-years-2020-21-2022-23-108414.pdf.
5. U.S. Department of Education. “Chronic Absenteeism.” U.S. Department of Education. January 20, 2025. https://www.ed.gov/teaching-and-administration/supporting-students/chronic-absenteeism. Accessed July 15, 2025.
6. National Center for Homeless Education. “Student Homelessness in America: School Years 2020–21 to 2022–23.” 2024. pp. 3.
7. SchoolHouse Connection. “2025 Fact Sheet: Educating Children and Youth Experiencing Homelessness.” 2025. https://e1.nmcdn.io/assets/schoolhouse/wp-content/uploads/2025/06/Educating-Children-and-Youth-Experiencing-Homelessness-2025-Fact-Sheet.pdf.
8. Ibid.
9. The National Center for Homeless Education. “Education of Children and Youth Experiencing Homelessness in the United States: School Years 2021–22 to 2023–24.” 2026. pp. 9.
10. Hatchimonji, et al. “High School Students Experiencing Homelessness.” 2021. pp. 5.
11. SchoolHouse Connection. “Seen and Served: How Dedicated Federal Funding Supports the Identification of Students Experiencing Homelessness.” 2023. https://schoolhouseconnection.org/article/seen-and-served-how-dedicated-federal-funding-supports-the-identification-of-students-experiencing-homelessness.
12. U.S. Department of Education. “American Rescue Plan – Homeless Children and Youth (ARP HCY) National Outcomes Summary.” 2024. https://www.ed.gov/media/document/arp-hcy-national-outcomes-summary-109427.pdf.
13. Centers for Disease Control and Prevention. “Youth Risk Behavior Surveillance System (YRBSS) 2023 YRBS Data User’s Guide 2023 YRBS Data User’s Guide Table of Contents.” 2024. pp. 51. https://www.cdc.gov/yrbs/media/pdf/2023/2023_National_YRBS_Data_Users_Guide508.pdf.
14. Centers for Disease Control and Prevention. “Youth Risk Behavior Surveillance System (YRBSS) 2023 Combining YRBS Data Across Years and Sites.” 2024. https://www.cdc.gov/yrbs/media/pdf/2023/2023_yrbs_combining_data.pdf.
15. The National Center for Homeless Education. “Student Homelessness in America: School Years 2020–21 to 2022–23.” 2024.
16. Ibid.
17. National Center for Homeless Education. “Student Homelessness in America: School Years 2017–18 to 2019–20.” 2021. https://nche.ed.gov/wp-content/uploads/2021/12/Student-Homelessness-in-America-2021.pdf.
18. National Center for Homeless Education. “Student Homelessness in America: School Years 2018–19 to 2020–21.” 2022. https://nche.ed.gov/student-homelessness-in-america-school-years-2018-19-to-2020-21/.
19. National Center for Homeless Education. “Student Homelessness in America: School Years 2019–20 to 2021–22.” U.S. Department of Education. 2023. https://nche.ed.gov/student-homelessness-in-america-school-years-2019-2020-to-2021-2022/.
20. National Center for Homeless Education. “Student Homelessness in America: School Years 2017–18 to 2019–20.” 2021.
21. National Center for Homeless Education. “Student Homelessness in America: School Years 2018–19 to 2020–21.” 2022.
22. National Center for Homeless Education. “Student Homelessness in America: School Years 2019–20 to 2021–22.” 2023.
23. National Center for Homeless Education. “Student Homelessness in America: School Years 2017–18 to 2019–20.” 2021.
24. National Center for Homeless Education. “Student Homelessness in America: School Years 2018–19 to 2020–21.” 2022.